Typefaces

Updated February 5, 2014 to correctly display the LaTeX screenshot, minor prose edits, and added discussion of font styles.

I do not know if you have a favorite font. I do. I really like Microsoft’s Calibri font because it is very readable on screen and paper and it looks professional. With that in mind, it has several huge shortcomings for much work. Let me list

  • You don’t have a right to use the font unless you have purchased it (for $120) or acquired with a legal license of a Microsoft product that includes it.
  • Calibri does not have small caps family member
  • Calibri does not have a corresponding math font

Many people, including me, got to know Calibri because it is the default font in Microsoft Word. I am trying to find a way to leave Word because it has poor support for equation numbering, mediocre bibliography support. It is also difficult to automate updated graphics using non-Microsoft work flow. For example, I often generate graphics in Python with Matplotlib and write them to a file. I would like my document workflow to pick up the picture automatically when it changes but have not found a reliable way to do this in Word.

Microsoft Word is fundamentally poor at rendering documents compared to a display tool like Adobe Reader. Consider the following screenshot comparing a default Word document snippet in Calibri with Word’s rendering of text in the TeX Gyre Bonum OpenType font. Next screenshot is from a Word display at 100% zoom.

word_example

The shading in the Bonum section is appalling. Look at the dot over the letter i in pi. Word renders the compatible TeX Gyre Bonum Math and TeX Gyre Bonum fonts differently depending on whether it is in equation mode or body text. The shading in the top paragraph is good; however, the overall construction is horrible. In Word a number in equation mode is displayed in the default math font Cambria. Calibri does not match Cambria and the two numbers can’t look the same. Furthermore, the fraction in the middle of the paragraph causes the line spacing to expand just on that line, making it look almost like there are more paragraph breaks than there should be. Distracting and unattractive.

The next picture is screenshot from Adobe Reader X at 100% zoom viewing a LuaLaTeX generated LaTeX document.latex_example

First, the TeX Gyre Bonum snippet is readable and reasonably good looking. The math font and text font are indistinguishable, as they should be. LaTeX handles even Microsoft’s pet font Calibri better than Microsoft. The fraction renders clearly and readably. It does so without creating a large horizontal gap.

The ideal faces, from my point of view, should:

  • Be embeddable in your electronic documents
  • Not cost much to install on every system you want to use (eleven computers at least)
  • Work on Windows, Linux, and MacOS
  • Include regular, bold, italic, bold italic, small caps, and math families
  • Be functional with Word or other non-LaTeX tools.

The license problem is unquestionably the most limiting factor since OpenType now seems to allow fonts to work across platforms. The GUST project has created a series of libre fonts called the TeX Gyre fonts. Among these fonts, only three have the math family, and all three of these satisfy the other requirements.

TeX Gyre Bonum Based on URW Bookman L
TeX Gyre Pagella Palatino-like
TeX Gyre Termes Times-like

There are several other Gyre fonts that are quite attractive and potentially useful but lack the math fonts. TeX Gyre Schola seems to be planning a math font which is not yet ready. If you don’t need to have a math font, or don’t need a matching math font then there are many other fonts to consider. Fontsquirrel has a lovely list of libre fonts. There are other fonts available for LaTeX that can produce good results but do not seem to have a functional method to work with other tools.

Wikipedia describes Calibri as a “humanist sans-serif typeface”. The closest TeX font with math support, to my eyes, is KP Sans-Serif. The strokes are not as modulated so the KP looks less refined than Calibri. I do not see how to use that typeface outside of LaTeX. If you are interested in other LaTeX fonts, consider looking at the LaTeX font project fonts with math support.

Does the Bathroom Fan Do Anything?

Other than make noise, that is. I built the most recent version of my Arduino-based data logger (the RIMU), and was looking for something to log. I’ve had this question for many, many years—does the bathroom fan actually do anything? It makes noise, deafening Niagara falls thundering noise. The mirror still gets foggy, though, and condensation still forms on the fixtures. Is there something good about all that noise?

Investigating this with the RIMU is more difficult than you might think. First, it is hard to control the variables. I recorded about seven days’ worth of data before I got two records that had similar enough baselines to separate the effects of the fan. Second, the analysis had so many measurements to work with.

Our bathroom is modest in size, with a counter and sink on one side and the shower on the opposite. The RIMU was sitting on the counter.

Humidity

The plot below shows the relative humidity over time. At approximately time zero I turned on the light. Shortly thereafter I turned on the shower, and the humidity began to rise. Weirdly, the humidity rose in a very similar fashion for the first few minutes. Probably the separation is when I climbed into the shower. I speculate that the dip at six minutes in the green “fan off” curve is climbing into the shower too. Opening the shower door, it seems, sets up different air currents.

humidity

One conclusion, clearly, is that the fan actually keeps the humidity under about 90%, instead of letting it rise to 100%. Another conclusion is that, compared to leaving the bathroom door open, the fan is really ineffective. A third conclusion is that the sound and light data are actually more interesting than the humidity data.

Light

The TSL chip that I use to sense light is quite a wonderful little device. It has controllable integration time. The idea is that if it there is a low light level the sensor can record longer to provide a better estimate of the actual level. In the RIMU I try to auto-tune the integration time. If the reading is very low, I increase the integration time, if it is very high, I decrease it. Unfortunately, when I programmed the RIMU I did not realize that the TSL library was providing measurements that had to be corrected for the integration time (counts, not Lux).

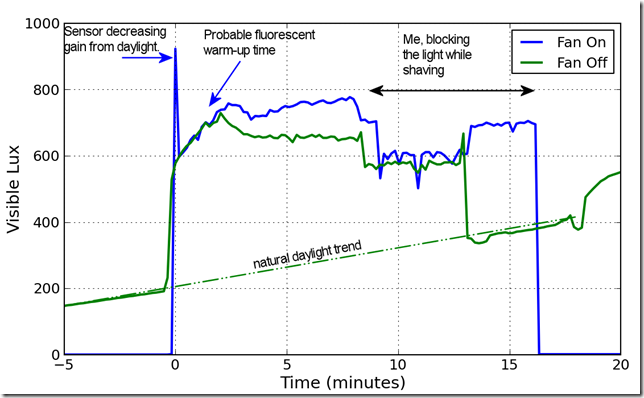
That brings us to the first interesting observation. In the blue “fan on” trace, there is a really whopping spike in the light level. What is actually happening is that there is a recorded measurement before the TSL integration time is reduced.

The second cool observation is that you can see the fluorescent lights increase their output as they warm up. I knew, intellectually, that this was happening—my scanner won’t scan until its fluorescent tube has warmed up. I always thought that was a 20 second process, not a three minute process.

The third cool observation is the visible background in the green “fan off” line. I took that recording on a Saturday morning, and the natural daylight trend is visible in the background.

light

Sound

The RIMU code runs in a constant loop, as fast as it can. The downside is that the sample rate on a polled sensor is whatever it can provide—not a specific value that you wish. RIMU records a sample to the SD card about every 10 seconds. In between it takes a reading of the sound pressure level as often as possible, and then averages them. The average is a moving average implemented with a single pole infinite impulse response filter. This is the simplest filter of all, something like

SPLaverage = SPLaverage*0.99 + measurement*0.01

sound_level

The first observation is that the moving average is not very cleverly implemented. The response time is nearly 3 minutes—something like 10 seconds would have been better.

The second interesting thing to observe is how unimaginably loud the fan is. The fan more than doubles the sound level compared to the water flow. The noise during shaving is due to turning on the faucet, which was very close to the RIMU.

Temperature

The temperature in both trials increased an average of about 2 degrees Fahrenheit. The fan may provide some mixing of the air, that keeps the temperature more even—the blue “fan on” line rises much less than the green line.

temp

Conclusion

Yep. The fan does something. If controlling humidity is really important (is it?) then you should just leave the door open. If you can’t leave the door open, turn on the fan.

PaintShop Photo Pro X3

The latest version of Corel Paint Shop Pro is now apparently called PaintShop Photo Pro X3.  Perhaps they’ll eventually regret their ridiculous naming.

Many things are the same since the previous version.  The obvious differences are that the menus have been re-colored to be higher contrast.  I find it overdone and a little garish, but not a big deal overall.  To me the old version (figure right) is easier to read.

menu-cap

The single feature I wanted most from Photoshop’s line was the vibrancy adjustment.  Unlike Photoshop, PaintShop includes the vibrancy adjustment as a standard image operation (accessible through Adjust –> Hue and Saturation –> Vibrancy).  This is considerably superior to Photoshop, which only includes it in the RAW import tool.  The vibrancy adjustment works on 8 bit/channel and 16 bit/channel images like many of PaintShop’s tools, in contrast to most of Photoshop Elements’.  Corel could have done better though; I was disappointed that the vibrancy is not available as an adjustment layer.

Corel upgraded the photo organization tools some, and there are distinct improvements.  Like Picasa and Elements, photos can be grouped virtually into “Collections”.  Other software may call them albums.  The organizer does a passable job of including the EXIF and IPTC data.  Captions in Picasa show up in the “Description” IPTC field, rather than the “Caption” field, so moving between those two programs at least is a little bit of a pain.

The tag editor is quite disappointing, as it does not appear to have any method of making common tags easily accessible—which means typing “Angus Hays” for every picture that includes my dog Angus.

The “email picture” capability did not improve in any important way–it is still just tied to the Windows MAPI system.  Fine if you’re brain damaged enough to use Outlook, but a complete failure for those of us in the Gmail crowd.

The upload tools for interfacing to web services appear to be part of a different application called “Corel PaintShop Photo Project Creator” which rolls off the tongue.  CPSPPC seems to be worthless, as it only interfaces to Facebook, flickr, and YouTube.  There is no option to add plugins or support for Picasa, MPIX, or any of the other services I use regularly.  CPSPPC provides tools to make backups, photo books, uploads, order online (only from Corel’s affiliate, who is not named prior to upload, does not offer an ICC profile, etc.).  Furthermore CPSPPC does not include any of the Photo Organizer’s tools for searching—all the albums you created in PSP Organizer are useless if you want to use them in, for example, a photo book.  Unbelievable, the project manager must be a drooling moron.

Anyway, Picasa offers services like that which are orders of magnitude better than Corel’s or Adobe’s—it is really the photo editing tools that I care about.  It is worthwhile to know that Corel is still ranked third in class on photo organization.

I wanted Corel to include an “Out of Gamut” display to help with color management, and that is sadly missing.  They did not appear to have changed anything about their color management processing at all, it is still basically OK but not exactly mind blowing.

Corel Releases New Paint Shop Pro

Despite Corel’s dreadful marketing, it appears today’s quasi-clandestine webinar was to unveil a new version of Paint Shop Pro, now with the awkward name Paint Shop Photo Pro X3.  For pity’s sake.

However, it appears to have included at least two things I care about:

  • Better speed by multithreading (though there is no indication of GPU-based acceleration)
  • RAW processing including vibrance

You may recall that vibrance was the one feature from Photoshop that I really wanted in PSP, and with that I think we have a nearly complete sweep.

Corel loaded in a bunch of other features that I expect to be disappointed in, such as a photo organizer; it is unlikely they’ll top Picasa for my uses.

You can visit their sales page here.  They are offering a free trial– I will almost certainly upgrade.  With luck I will post a review this weekend.

Old Family Pictures

For Christmas I received a box of slides that had belonged to my grandfather. The slides were 35 mm taken between 1955 and 1961, in a mixture of black and white and color. I do not own a slide projector, and some of the film was starting to deteriorate, by yellowing or showing blotches where the emulsion had retreated. It was apparent that these slides would be much more enjoyable converted to digital, and so I scanned them. This entry is the story of that scanning, for the technical voyeur and for my own notes.

box_open

The first step was to determine the resolution at which to scan the slides, and possibly a lower resolution for the final scan. Usually when I scan photographs I try to scan at about the resolution of the original image–usually about the scale of the “graininess” in the image. If the graininess is smaller than the blurriness in the picture I would scan to fully sample the blurriness, but no finer.

There are some resolution choices to consider that do not require experimentation. Velvia 50, which has a reputation as an excellent film, indicates resolution typically coarser than 150 lines/mm (3,810 lines/inch). 150 lines/mm corresponds to an equivalent of about a 20 megapixel camera. A recent era camera like the Nikon D300 has a 12.3 megapixel sensor, which corresponds to a resolution of 119 lines/mm (3,030 lines/inch), after adjusting to make it 35 mm equivalent.

The following picture shows a portion of a color slide scanned at my scanner’s maximum resolution,12,800 samples per inch, followed by a resampled version of the same image at 2,133 dpi (1/6), followed by too coarse a scan at 1,067 dpi (1/12). Notice that the correct resolution is not far from a 6 megapixel camera, about the same as my Nikon D40.colwideframe

col_multires

The following picture follows the pattern of the color slide, but is of a black and white slide. The resolutions are the same as with the color slide.  For the small parts I have radically stretched the contrast.

bwwideframe

bw_multires

Bit Depth

I scanned at 16 bit/channel (48 bit color) for most slides. The reason to do this is that the slides require some significant color processing. Most of the slides are severely overexposed, and typically badly yellowed. In truth, if I were to simply fix the exposure issues and deal with the yellowing it might be OK to scan with 8 bit/channel. However, it is not clear that this processing is the last these slides will see. While the final output of the process stream will be a JPEG (which is limited to 8 bit/channel) I would like that JPEG to be fully utilized so that future editing does not lead to posterization or banding.

It may be helpful to understand posterization, also called banding. The following picture shows an image with 8 bits per channel, or 16 million colors, then 256 colors, and then 16 colors. Obviously the 16 color version is totally unacceptable. The 256 color version is visibly worse than the 16 million color version, look especially at the reddish object in the lower right.

tooFewColors

The following diagram shows the image and histograms at two stages of processing, one starting with a 16 bit/channel image, and one starting with the same image at 8 bit/channel. Notice how the histogram in the final section of the 8 bit/channel image has deep valleys between the peaks—effectively that histogram is showing banding. Because the banding is nearly invisible in the 8 bit/channel image I think I could reasonably scan at 8 bit/channel; however, it would not take much more processing to produce visible posterization in the image scanned at 8 bit/channel.  The only two operations performed on this scene are contrast enhancement using a “curves” tool and color correction using the “color balance tool”.

color_stretch

Corrections

The slides include a variety of flaws. Most of them are underexposed. Most of them have also yellowed with age. There are places on some slides where the emulsion has what appear to be crystals growing, and others where the emulsion has retreated from small sections.  The following picture shows dark spots in some areas which are the caused by this crystalline looking deposit.

crystals

The following slide has clear parts, where the emulsions appear to have retreated.  On most slides this is only near the edge and the best solution is cropping.  However, on some slides it affects a subject’s face and must be hand painted.

emulsion_retreat

Color correction and contrast enhancement was performed with the “levels” or “curves” controls and the “color balance” tools. The results of those operations are shown on the following image.  The left-most frame is the original scan, which looks like a badly overexposed black and white picture.  The middle image has somewhat better exposure, but looks like a sepia toned image.  The rightmost picture is color corrected, and reveals that photograph was not actually black and white, but a color photo.  Note that this picture isn’t really worth saving due to the motion blur and subject matter, but it is revealing of the impact of basic editing.

color_levels_2

In addition, the process of digitizing the image introduces dust motes and fibers, some of these dust particles are clearly visible in the frames above.  To control the motes and fibers I brushed each slide on both sides, brushed the light source, and cleaned the scanner bed between each scan.

scanner_bed

Most mote correction was accomplished with the clone brush. This worked for any region where the pattern was consistent and broad, such as the sky, or on gravel. However, across people’s faces the clone brush did not produce very good results.

The fibers often crossed faces or fingers, or other hard-to-clone regions. The brush seemed powerless to remove the fibers too, though it was efficient at moving them. The dirtiest slides were scanned twice, with brushing in between. Then the slides were overlaid, masked, and the top slide’s dirty parts erased to reveal the clean slide underneath.

While the method is effective, it is also a pain. In addition to doubling the scanner time, it increased the processing substantially. The slides had to be registered very accurately for the method to work. This required careful positioning, and rotation. Both operations were agonizing due to my computer speed. For color slides it was nearly intolerable, as my software crashed when I tried to use more than one color 16 bit/channel layer.

For reference, to register two images you take the two scans and make them layers in a single image, then set the “blend mode” to “difference”.  Perfect registration will reveal a black screen.  The figure below shows the full image on the right, and the difference image on the left.  The white outlines tell that I don’t have the image exactly registered, perhaps the rotation is a little wrong.registration

The layers that comprise a finished product include the two “rasters” and the “mask”, as shown in the layers dialog below.

layers_palette

Except for some scripting to automate the resizing, that is all the processing I did.  May my example be of service.