Arduino Flickering Candle

Update December 24, 2013: Mokus refined his code so that the distribution is now well-behaved (nearly normal) and the PSD no longer turns up at high frequencies). The plots and post have been updated to reflect this change. He will push code to the same link as available.


In my previous post on Candle Flame Flicker I describe the statistics of the optical intensity flicker from a candle in terms of the probability density of the brightness samples and in terms of the power spectral density of the brightness. In this article I discuss how to make an Arduino drive an LED to flicker in a way that is statistically similar to the measurements I took on a real candle.

In the measurements I observed the spectral roll-off of the candle to start between about 5 and 8 Hz, and to decline at a nominal rate of around 44 dB for each decade increase in frequency. The 2nd-order infinite impulse response filter is computationally efficient in terms of using a small amount of memory and requiring few calculations. However, the Arduino is not good at floating point arithmetic. On the Arduino, floating point is done in software, has relatively few bits of precision, and is about 4 to 40 times slower than fixed point (integer) math. It is quite difficult to find useful benchmarks. The basic process is to create white noise and then filter it to the correct spectral shape. Afterward, the signal is scaled to have the appropriate variance and offset with a constant to represent the average brightness of the “flame”.

The approach I used was to design the IIR in Python with scipy’s signal module. I specified a 2nd order lowpass Butterworth filter, specifying a cutoff frequency of 8 Hz, and a sample frequency of 60 Hz. I normalized the coefficients to work in a 16 bit integer space, following Randy Yates’ 2010 Practical Considerations in FIR Fixed Filter Implementations, mainly. From a synthesis perspective, there is some prior art. Philip Ching, a student at Cornell synthesized candle noise quite cleverly, though he neither reported nor replicated the correct statistics. A fellow with the handle Mokus did a very, very tiny implementation for a microcontroller with only 64 bytes of RAM. He helped me modify his code so I could compare his statistics, and after adjustment his spectrum and distribution match fairly well. The high-frequency of his PSD looks a little different from the other methods, but these may not be noticeable to the observer. Finally, there was Eric Evenchick’s coincidental post on hackaday. Mokus reported that Evanchick’s implementation has too slow an update rate; I noticed that Evanchick did not report on the statistics he was targeting nor what he achieved. I did not recreate his work to test.

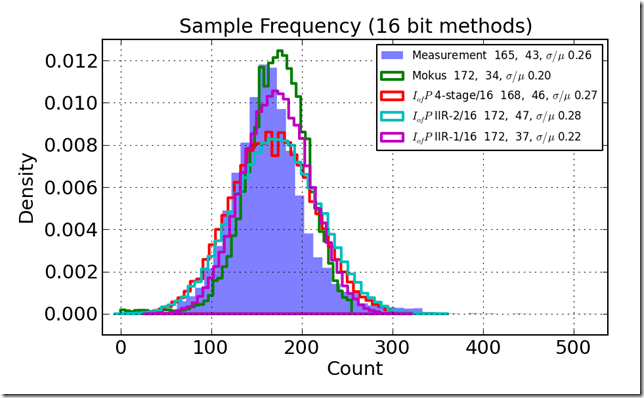
Then, on to the tests. I really was interested in building and comparing statistics from a 16 bit implementation, a 32 bit implementation in both a Direct Form I and a Direct Form II implementation. Indeed, I had great difficulty getting the filters to perform because I kept misdesigning the integer coefficients and overflowing the registers. As I sought a solution to the 2nd-order filter approach, I also created a 4-stage digital equivalent of an RC filter. The 4-stage RC approach was always stable though it needed a higher sample rate and used much more processor power to create statistically consistent results. On the other hand, it has a more accurate spectrum. A comparison of three different 16-bit methods to Mokus’ and to the actual measurements is shown in the figure below. The legend shows the mean, standard deviation, and their ratio to the right of the label. The All my filters did a credible job of reconstructing the histogram.

histo_compare_16

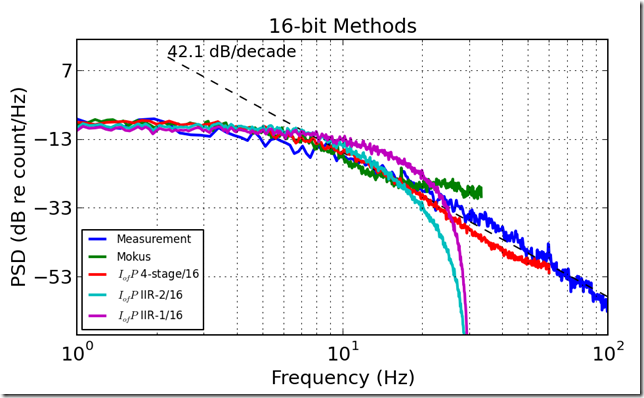
The power spectral density (PSD) of the different methods tells a different story. The Direct Form II 16 bit filter is the most visually appealing of the methods I tried. It rolls off more like the physical data than the other methods, except compared to the 4-stage RC filter. The Direct Form II filter is more computationally efficient.

psd_compare_16

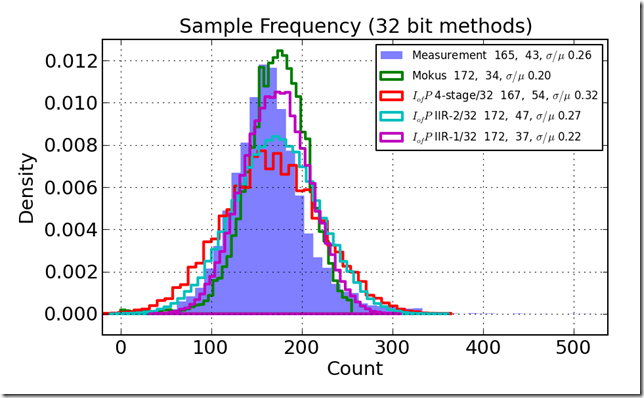
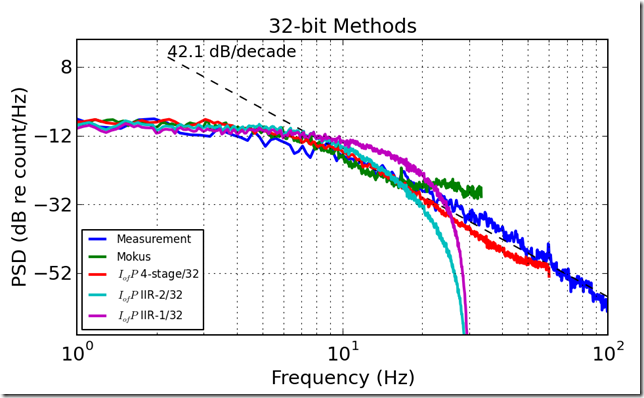
The results for the 32-bit versions show greater variance than the 16-bit versions, but the quality is not markedly better.

histo_compare_32

psd_compare_32


I wrote a proof code for the Arduino UNO both to see it flicker and to test the processor speed—separate parts of the code. The results are that compiling with 1.0.3 resulted in a 4,722 byte program that calculated 10,000 new values in 6,292 ms, or 629 microseconds per value. In theory this could produce a sample rate of nearly 1.6 KHz. Or another way of thinking about this is that the final code uses about 629 us/17 ms or about 4% of the processor capability of the Arduino UNO. That leaves a lot of resources available to do other Arduino work or maybe means it can fit in a cheaper processor.

I have released two pieces of code under the GNU Public License 3, you can get the Python I used for filter design and the Arduino test code at the links. If you want the data, please contact me through the comments and I am willing to provide it.
Candle Flame Flicker

For a project I wanted to make an LED flicker like a candle. I searched for the signal statistics of candle flicker, and I found no data. One student web site suggests that candle flame flicker is a 1/f-type random signal with roll-off of 20 dB per decade increase in frequency. Similar processes are typical for turbulence, so this student’s plan seemed reasonable. However, the student did not discuss whether the signal is Gaussian or not, and did not describe the low-frequency characteristics of the signal. 1/f noises may have a spectrum that follows the 1/f curve to very low frequencies, but because they would require infinite power at f=0 they always have some lower frequency change. I had no data.

Candles aren’t hard to get, and I already had a silicon photodiode for an absorptive smoke density measurement system I’m working on. I also had an analog-to-digital converter (ADC) in an ADS1015 on a breakout board from Adafruit. I made the very simple circuit shown below and attached it to a Raspberry Pi to sample the data. There are a lot more details, but those are later.

circuit

The voltage measured by the ADC is directly proportional to the current through the resistor. The current through the reverse-biased diode is directly proportional to the incident optical power. Very simple. I recorded a minute of data at a low 250 Hz sample rate, and subjected the data to analysis. The setup was a nominally dark room with the sensor a few inches from the flame. I flapped my hand at the candle to get it to flicker while recording.

20131211-04

20131211-06

20131211-12

The first graph below is a histogram of sample values.

dfile_hist

The histogram is about normally distributed, but the right-hand tail is not Gaussian; it is too fat. In other words the candle is occasionally much brighter than normal. The time series (below) shows the same properties. There are clearly visible large excursions.

dfile_time

For human eyes the candle’s flicker will be well represented if the frequency spectrum of the flicker and the distribution of the flicker approximately match a natural source. The spectrum below can be thought of as an average brightness (the peak at the left), a flat spectral region out to about 4 Hz, and then a 1/f-style roll off at 44 dB per decade.

dfile_psd

Numerically, we have the recipe for a flickering candle:

  • Samples should be normally distributed with a standard deviation equal to 0.25 of the mean.
  • The power spectral density of the signal should roll off at about 40 dB per decade with a 3 dB cutoff frequency around six cycles per second.

To make this work on the Arduino using the pulse-width modulated outputs, we can further constrain the problem:

  • The maximum value cannot exceed 255 counts—or make the limit that the mean plus two standard deviations is 255.
  • From this, we can derive that 2s+m = 255, use the fact that 0.25m=s to find that the mean m=170 and the standard deviation is about 42.
  • A sample rate of between 30 and 120 Hz should be more than adequate to satisfy the Nyquist criterion for human vision (see Wikipedia).
  • Values may not go below zero or above 255
  • A second-order infinite impulse response (IIR) filter has a roll-off of 40 dB per decade

If we can find a numerically efficient way to generate a time-series of Gaussian random variables inside the Arduino, filter them with a 2nd-order fixed-point IIR, scale them (if needed) then we should be able to make a flickering candle.

Unfortunately, I have failed repeatedly to get a stable fixed point IIR filter. The cookbook solution specification above should be easy to implement, but I have not found it so. A better solution will have to wait for another post.

That Noisy Fan–Calibrated Measurement

I am working with the freetronics microphone module, which is described as having a sensitivity of “-40 dB typical”—let us assume it is dB (SPL) referenced to 20 micropascals root mean square (rms) at 1 KHz. When I think of an electronic element’s sensitivity, though, I’m thinking volts per micropascal and this is not provided.

The microphone’s schematic suggests the SPL measurement is the rms average over 3 milliseconds, and that the signal is proportional to rms pressure level. This suggests a log scale for display (a change from previous work).

The upshot is that the fan generates about 62 dBA; but to get that conclusion, I had to perform a spectral correction to match measurements from a more calibrated sensor.

sound_level_dba

Remember that I made the measurements with the RIMU data logger I built. That data logger has a digital low-pass filter on the microphone SPL. The low-pass filter has much too slow a response, but the basic result is OK. The RIMU, shown in the next picture, is the instrument.

20130803-24

I borrowed an SPL meter from my father (thanks!). It is, unfortunately, a C-weighted measurement, measuring in dBC. The C-weighting is occasionally a very useful measurement of sound level. Most measurements are done A-weighted, which is similar to human hearing. My challenge is to convert a measurement made with an unweighted microphone in arbitrary units to A-weighted measurement in dBA. The answer is to take a measurement with the instrument in dBC, and record the sound a with a sound recorder, figure out what converts C-weighting to A-weighting for this signal.

20130803-25

In the spectra below you can see that the spectrum recorded without weighting, by the Zoom recorder. I then applied an A weighting and a C weighting. What’s important is the conversion between the rms value for A and the rms value for C, which is a 6 dB correction in one case, and a 13 dB correction in the other.

fanandwater-psd


fanonly-psd

So, to rehash the steps

  • Record a sound level with the RIMU
  • Measure a reference condition in dBC with the SPL
  • Record a 15 second period with the Zoom
  • Apply the A weighting to the Zoom record
  • Apply the C weighting to the Zoom record
  • Find the difference in dB between the A and C weighted records
  • Assume the dBC weighting corresponds to the measurement made with the RIMU, and adjust the RIMU values so that they match the C-weighted measurement from the SPL
  • Apply the C-to-A correction to the RIMU measurement.

Pretty epic pain, but at least I have the measurements. In the future I will recode the RIMU to take short A-weighted and C-weighted snapshots, and then calibrate the RIMU on the dBA record. Look for a follow-up post far in the future.

Arduino Analog Sample Rate

The Arduino Uno is not the ultimate signal processing machine, but it can do some light duty work on burst data. I had trouble finding the maximum sample rate the Uno can support, which is totally critical for most kinds of work.

With native prescale

  • Samples, type casts into floats, and stores in an array at about 8929 Hz, or 112 microseconds per read-and-store
  • Samples and into stores into an array of unsigned integers (16 bit) at about 8930 Hz, or 112 microseconds per read-and-store

We can step this up quite dramatically by setting the prescale set to 16:

  • Samples, type casts into floats, and stores in an array at about 58600 Hz, or 17 microseconds per read-and-store
  • Samples and stores into an array of unsigned integers (16 bit) at about 58606 Hz, or 17 microseconds per read-and-store

Pretty close to a 60 KHz sample rate, more than adequate for audio sampling. Of course, the Arduino doesn’t have enough memory to be a serious audio processor, but it is pretty goood.

The forums discuss this, and arrive at a similar conclusion.

#define NSAMP 5000

void setup(){
  Serial.begin( 57600);
 
  float array_float[ NSAMP]; // float
  unsigned int array_int[ NSAMP]; // 16 bit
  unsigned long int micsbegf, micsendf, micsbegi, micsendi;
 
  for( int i = 0; i < 2; i++){
    if ( i == 1){
       // Set prescale to 16, and retry
      sbi(ADCSRA,ADPS2);
      cbi(ADCSRA,ADPS1);
      cbi(ADCSRA,ADPS0);
    }
    
    // Record floats (extra time for type conversion presumably)
    micsbegf = micros();
    for( int i = 1; i < NSAMP; i++){
      array_float[ i] = (float)analogRead( A1);
    }
    micsendf = micros();  
    
    // Record floats (extra time for type conversion presumably)
    micsbegi = micros();
    for( int i = 1; i < NSAMP; i++){
      array_int[ i] = analogRead( A1);
    }
    micsendi = micros();  
   
    if( i == 1){
     Serial.println("with prescale set to 16");
    } 
    Serial.print("recorded ");
    Serial.print( NSAMP);
    Serial.print(" float samples in ");
    Serial.print(micsendf - micsbegf);
    Serial.println(" usec");
    
    Serial.print("recorded ");
    Serial.print( NSAMP);
    Serial.print(" unsigned integer samples in ");
    Serial.print(micsendi - micsbegi);
    Serial.println(" usec");
  }
}

void loop(){
  delay( 10);
}


Does the Bathroom Fan Do Anything?

Other than make noise, that is. I built the most recent version of my Arduino-based data logger (the RIMU), and was looking for something to log. I’ve had this question for many, many years—does the bathroom fan actually do anything? It makes noise, deafening Niagara falls thundering noise. The mirror still gets foggy, though, and condensation still forms on the fixtures. Is there something good about all that noise?

Investigating this with the RIMU is more difficult than you might think. First, it is hard to control the variables. I recorded about seven days’ worth of data before I got two records that had similar enough baselines to separate the effects of the fan. Second, the analysis had so many measurements to work with.

Our bathroom is modest in size, with a counter and sink on one side and the shower on the opposite. The RIMU was sitting on the counter.

Humidity

The plot below shows the relative humidity over time. At approximately time zero I turned on the light. Shortly thereafter I turned on the shower, and the humidity began to rise. Weirdly, the humidity rose in a very similar fashion for the first few minutes. Probably the separation is when I climbed into the shower. I speculate that the dip at six minutes in the green “fan off” curve is climbing into the shower too. Opening the shower door, it seems, sets up different air currents.

humidity

One conclusion, clearly, is that the fan actually keeps the humidity under about 90%, instead of letting it rise to 100%. Another conclusion is that, compared to leaving the bathroom door open, the fan is really ineffective. A third conclusion is that the sound and light data are actually more interesting than the humidity data.

Light

The TSL chip that I use to sense light is quite a wonderful little device. It has controllable integration time. The idea is that if it there is a low light level the sensor can record longer to provide a better estimate of the actual level. In the RIMU I try to auto-tune the integration time. If the reading is very low, I increase the integration time, if it is very high, I decrease it. Unfortunately, when I programmed the RIMU I did not realize that the TSL library was providing measurements that had to be corrected for the integration time (counts, not Lux).

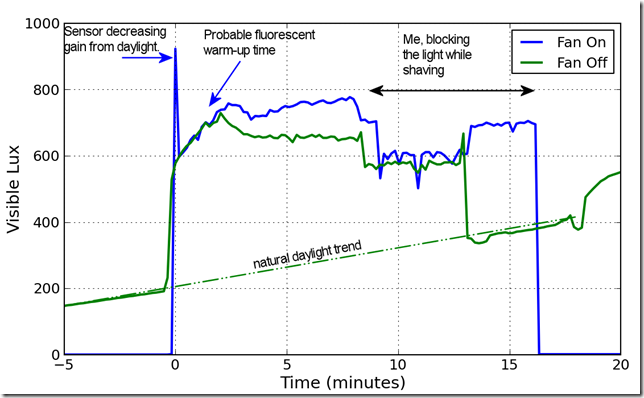
That brings us to the first interesting observation. In the blue “fan on” trace, there is a really whopping spike in the light level. What is actually happening is that there is a recorded measurement before the TSL integration time is reduced.

The second cool observation is that you can see the fluorescent lights increase their output as they warm up. I knew, intellectually, that this was happening—my scanner won’t scan until its fluorescent tube has warmed up. I always thought that was a 20 second process, not a three minute process.

The third cool observation is the visible background in the green “fan off” line. I took that recording on a Saturday morning, and the natural daylight trend is visible in the background.

light

Sound

The RIMU code runs in a constant loop, as fast as it can. The downside is that the sample rate on a polled sensor is whatever it can provide—not a specific value that you wish. RIMU records a sample to the SD card about every 10 seconds. In between it takes a reading of the sound pressure level as often as possible, and then averages them. The average is a moving average implemented with a single pole infinite impulse response filter. This is the simplest filter of all, something like

SPLaverage = SPLaverage*0.99 + measurement*0.01

sound_level

The first observation is that the moving average is not very cleverly implemented. The response time is nearly 3 minutes—something like 10 seconds would have been better.

The second interesting thing to observe is how unimaginably loud the fan is. The fan more than doubles the sound level compared to the water flow. The noise during shaving is due to turning on the faucet, which was very close to the RIMU.

Temperature

The temperature in both trials increased an average of about 2 degrees Fahrenheit. The fan may provide some mixing of the air, that keeps the temperature more even—the blue “fan on” line rises much less than the green line.

temp

Conclusion

Yep. The fan does something. If controlling humidity is really important (is it?) then you should just leave the door open. If you can’t leave the door open, turn on the fan.

Refigured Data Logger

The RIMU data logger I built last year received a major upgrade. I added a sound pressure level meter to learn how noisy it is and updated the case to make the switches easy to find, label, and operate.

It took a long time to get it working, mainly because I forgot that using the Adafruit Data Logger Shield occupies digital pins 10-13. Stupid mistakes were overcome and it is working now.

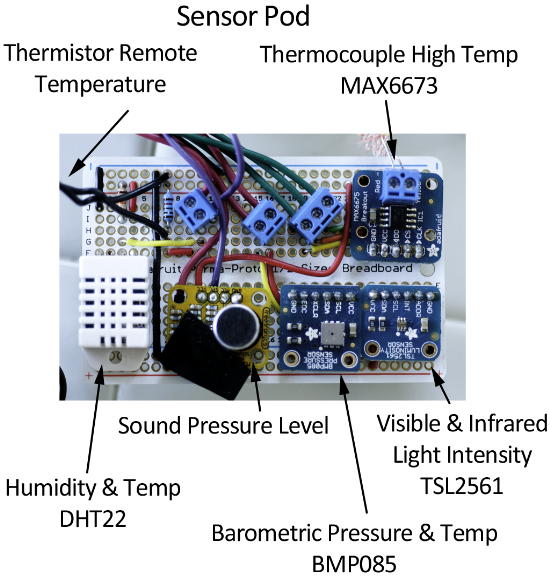
In the following picture you can see the sensor pod to the right and the main processor to the left. The reddish cable coil at the top right of the screen is the thermocouple, which I use to log high temperatures like the oven, barbecue grill, or smoker. The black cable running off-screen at the bottom right is for the thermistor. The thermistor is suitable for temperatures up to about 250 F, and is on thin enough wire that it can be placed outdoors while the electronics are sheltered indoors.

20130223-05

The display always shows the date and time—useful to confirm that logged data will be correctly time tagged. In the upper right of the display is a logging indicator (looks like L hugging a degree symbol). The degree symbol changes to a 1 when the logger is recording data.

The bottom row of the display shows the measurement from one sensor at a time. Hitting the mode button will step through all the modes. Unfortunately, this interface is awful. The Arduino is doing a lot, and it checks the button state as often as it can; however, it is common to press the mode button to no effect because the Arduino did not happen to check the pin at the time it was pressed.

20130223-17

There are 7 display states:

  • Thermocouple temperature (degrees C)
  • Barometric pressure (millibars) and temperature (C) from the BMP085
  • Visible light luminosity (lux) from the TSL2561
  • Infrared luminosity (lux) from the TSL2561
  • Sound pressure level (uncalibrated units, an integer between 0 and 1023)
  • Relative humidity (%) and temperature (C) from the DHT22
  • Thermistor temperature (F)

The relationship between the display states and the sensor pod are straightforward.

SensorPod

I’m happy with this design, but there are a few things I would change. First, I would like the state control to be a physical, mechanical switch. I could easily accomplish this with a 7-position (or more) rotary switch. I would wire resistors between each position, and then use an analog pin to read the state directly. A variable resistor with coarse detents would work too. So far I have not been able to find a variable resistor with coarse detents (but I can find one with very fine detents), and rotary switches are way too big for the case.

The other major thing I’d like to change is the physical interface between the Arduino case and the sensor pod. I would replace the terminal blocks with a finer pitch set that would fit on the board in a row and have enough room for labels. I would then use a bundle of 22 ga. stranded wires in different colors so that the sensor pod would be more flexible.

In software I need to make a change so that there is positive feedback to the user if there is an error writing to the log file. This should be easily accomplished, and is likely the next software change.

RIMU Calibration

I turned the freezer up to 7. I’m sure yours goes to 11, but I am not so lucky. After being turned up to 7, the resulting mean temperature is still too high at 18.8°F. And with that, we bid adieu to our refrigerator. It is around 20 years old—no way to be sure, and it has had a good life. I suppose the EPA would frown on a Viking funeral?

freezer_only

As a final check, I tested the thermometer by running it from a stirred ice bath up to a rolling boil. The ice bath temperature, averaged over about 1 minute, is about 33.1°F. A 1°F error does not present any problems.

freezer_only_annotated

Calibration in an ice bath is quite easy, but calibration at boiling is not. The pressure estimated from the RIMU predicts a temperature below the measurement, while the local airport’s barometric pressure predicts one above. In any case, the error is a few percent or less.

Freezer Swan Song

The last few weeks our ice cream sandwiches have been awful. I’m throwing away ice cream sandwiches, and I’m only marginally pickier than my dog. They’ve been gummy, almost squishy.

We have been suspicious of the refrigerator since we smelled a hot electric odor—like burning dust. I monitored the fridge with the RIMU, and it looked more or less reasonable. I monitored the freezer too, for one night. It is looking less good.

thrmstr_plot_annotated

In addition to the short-lived odor, there is another reasons to be suspicious. The fridge gets warm on the outside, notably warmer than it used to.

Normal fluctuation in freezer temperature should be about 5 degrees, measured with a mass-damping technique…that I did not employ. I estimated the air temperature variation, not the food temperature variation. The air temperature variation is larger. The air temperature swings through a larger range than I would expect.

The average temperature, though, looks altogether too high: 16°F. The normal target temperature is 0°F. I’m assuming some of the spikes are because we were accessing the freezer, but they may all be defrost cycles.

freezer_only_annotated

We’ll continue fiddling with the temperature control, but likely the freezer is singing its swan song. That’s one note, about 0.25 millihertz.

Heat Less with Better Blinds?

Evidence is mounting that closing the blinds can reduce the rate of heat decline—at least when the wind is mostly still. The figure compares the heat loss rate to the indoor-outdoor contrast. Higher rates are bad.

Closing the blinds keeps reduces the temperature loss rate by about 0.1 degree F/hour. Integrate that loss rate over the course of the night and closing the blinds keeps the house 1 degree F warmer.

heat_loss_trend-blinds

To keep the house 1 degree F warmer by turning up the thermostat 1 degree F during the night would increase energy use about 1%. This could save as much as 3% on the heating bill according to many sites who uniformly cite miserably.

My gas bill is about $70/month during the winter, assuming 4 months, I’ll save $8.40 per year by closing the blinds. This should pay for the blinds in only a little over 120 years.

I’ll continue collecting data, and may update this if the results change. Your mileage may vary.

Estimating the Home’s Heat Loss Rate

I’ve been collecting various sets of data with my Arduino-based RIMU.1 environmental data logger. In particular, I have seven nights worth of overnight records showing both indoor and outdoor temperatures. The data were all taken with the recorder in the same locations. Some nights are contiguous, but the 7-night set spans about 10 days.

The indoor temperature, during the “night” setting on the thermostat tends to drop quite linearly until the furnace runs again around 6 am. The following graph shows the data, which looks like a black staircase, along with a linear fit of the data. The fit is quite good.

I capture only one important datum from this overnight trend—the slope. Later I’ll show how I use the rate of temperature decline, measured in degrees Fahrenheit per hour of decline.

indoor_temp_exmpl

The outdoor temperature sensor is a thermistor, and the measurement is markedly noisier. The temperature varies more too, presumably due to wind turbulence near the house. The linear trend is much less clear, though it is clearly cooling some during the night. I do measure the average difference between the indoor and outdoor temperature which I call the “mean temperature contrast”. This is done in degrees Fahrenheit, though I probably should have done it in Kelvin. The contrast is measured as a difference, not a ratio.

outdoor_temp_exmpl

If I take the seven days of data and plot the temperature decline rate versus the temperature contrast I see the picture you might expect, below. Remember that bigger numbers mean faster falling indoor temperature. You can see the outlier caused by the windy night. There is another outlier (~28, ~0.60) which, if I recall correctly, is the one night I closed the blinds. A hint of the follow-on experiment.

The next question is, does closing the blinds cause this rate to be materially different?

heat_loss_trend